Debugging Fortran code in the Code::Blocks IDE
Code::Blocks IDE is distributed together with the Debugger plugin, which supports the GDB debugger. From within the IDE users can conveniently start GDB session and go line-by-line through the code execution path. “Code::Blocks for Fortran” v1.6 ads some improvements to the Debugger plugin that are relevant for Fortran. These customisations use GDB Python API, therefore GDB with Python support is required. The customisations: (a) Pretty printers for the character, complex and dynamic-type variables; (b) Possibility to visualize content of arrays as a curve (1D array) or 2D surface (2D array) directly from the debugger session.
Video tutorial, which demonstrates how to debug Fortran code using C::B:
Preparation of the system
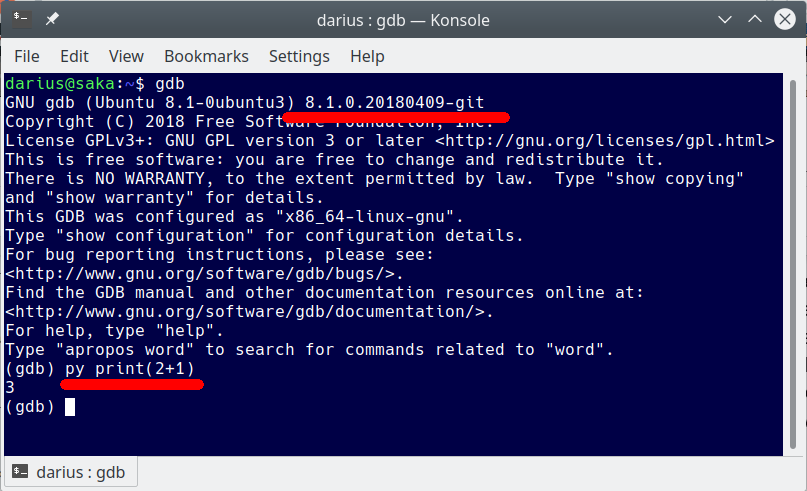
Before the start of a debugger session, make sure you have a recent GDB with Python support installed on your system. Open terminal (run “cmd” on Windows) and type “gdb”.

Significant improvements for Fortran was added in GDB 7.12 (7.11?). To test if your GDB has Python support, type “py print(2+1)” in GDB, as is shown in the screenshot above. If you become correct answer, the GDB on your system has the Python support. If the installed GDB is without Python support or/and is older, you should install a new one. For Windows users, I can recommend MinGW-W64 from https://sourceforge.net/projects/mingw-w64/ .
You may like to visualize content of an array from within C::B during debugging. This may help you to find a problem in an implemented algorithm more quickly. To enable this feature, install Gnuplot program (http://www.gnuplot.info/) on your system.
Debugging in Code::Blocks
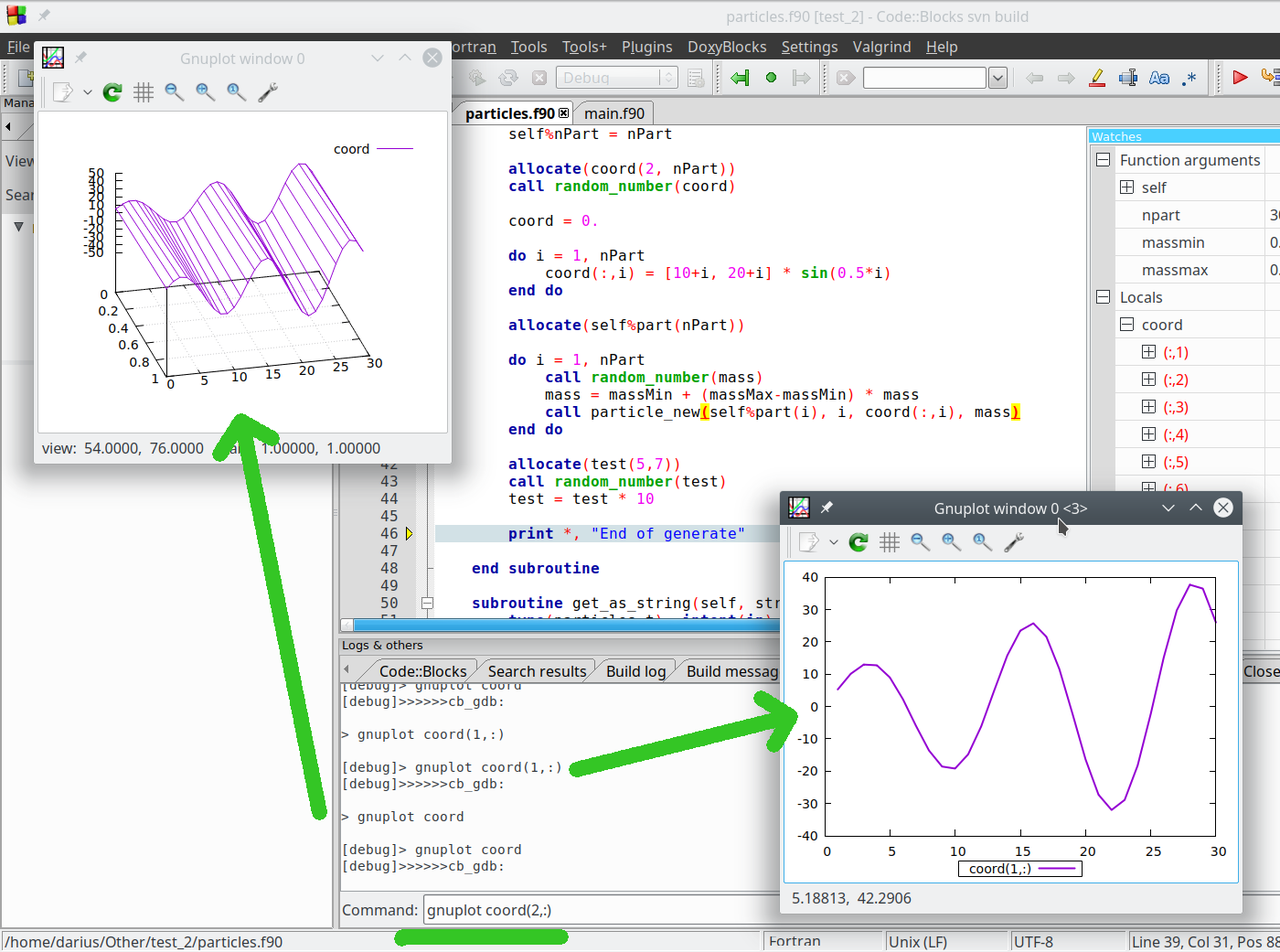
Start the C::B. Open your project. Compile the project with “-g” compiler option and disabled optimisations. Place the cursor somewhere in the code and start the debugger session by selecting menu “Debug->Run to cursor”. Values of variables are displayed in the pop-up window, when you keep the mouse cursor above a variable. You can also open “Watches” window by selecting menu “Debug->Debugging windows->Watches”. If you like to visualize the content of an array, type “gnuplot array_name” in the field for the GDB commands. See screenshot below.

Customisation
Some users may like to customize Python pretty printers or a way how arrays are visualized. No problem. You can do it. A Python file “gdb_fortran_extensions_v1.0.py” with GDB extensions are in “<C::B directory>/share/codeblocks/images/fortranproject/” directory. You can open it and make your changes.
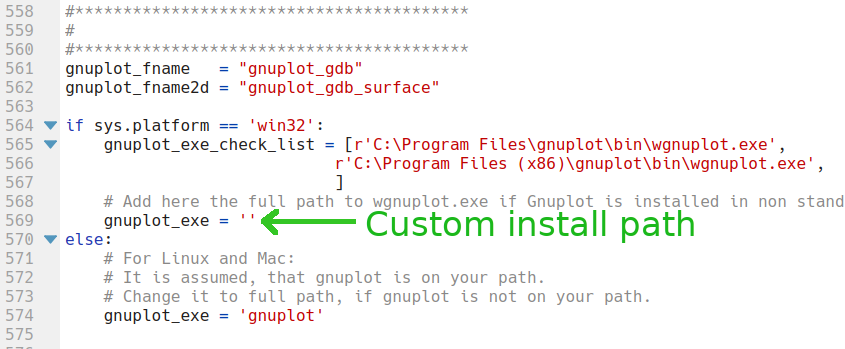
In the case you installed Gnuplot not in the default directory, C::B will not find it. In this case, you have to set “gnuplot_exe” variable to the correct value, where Gnuplot is installed (see screenshot below).

Every time when you execute “gnuplot array_name” command, Python copies “gnuplot_gdb.dem” or “gnuplot_gdb_surface.dem” file to your project directory and creates “gnuplot_gdb.dat” file with array data. You are free to customise *.dem files in “<C::B directory>/share/codeblocks/images/fortranproject/”. And please remember: It is user’s responsibility to delete *.dem and *.dat files from the project directory later.
